
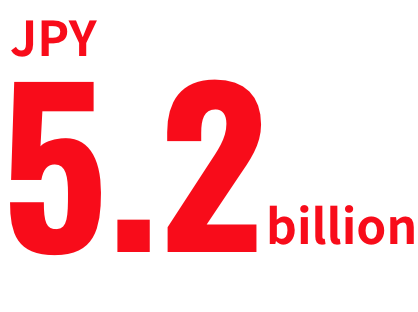
Sales amount

2012
2025
* The graph is an image
Net income

2012
2025
* The graph is an image
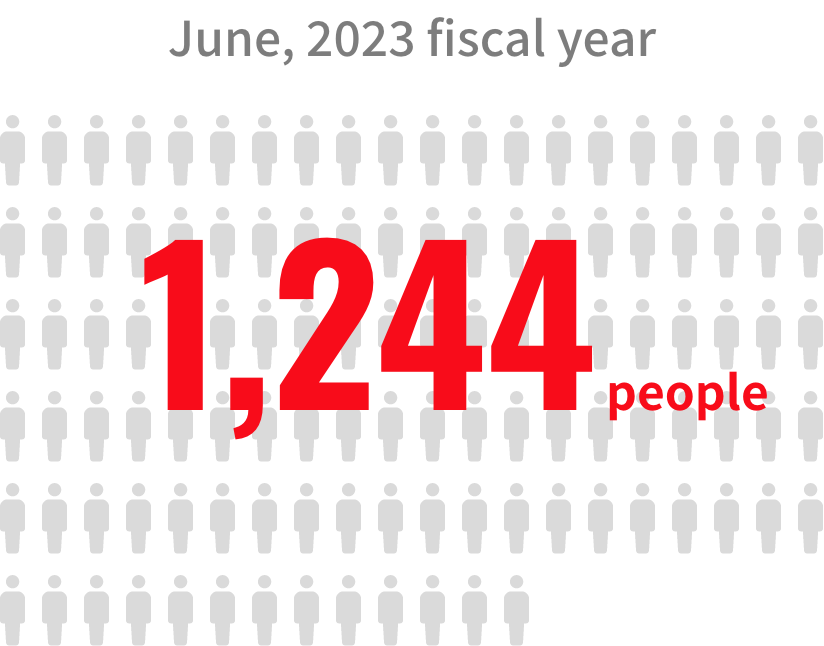
Number of employees

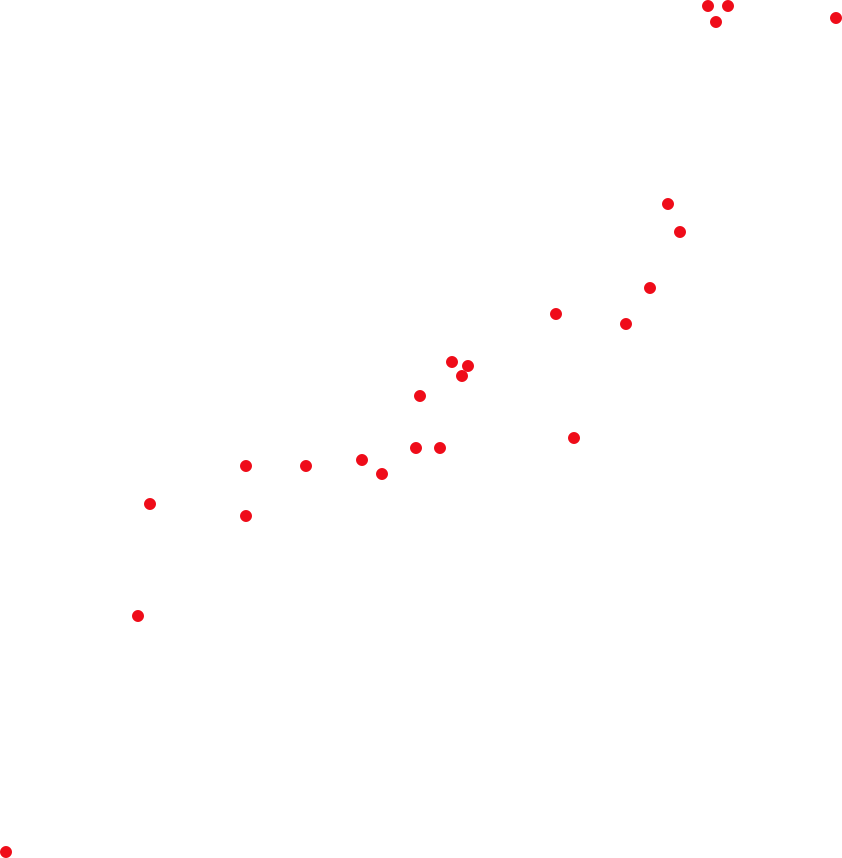
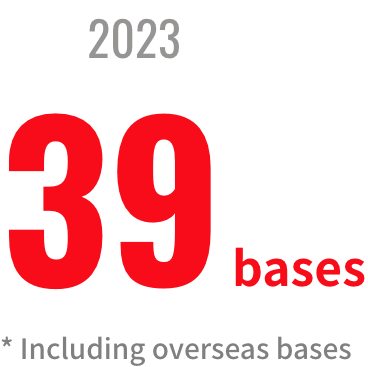
Number of company bases
(Offices / Factories)

Number of products


* The graph is an image
Length of the constructed
drainage material


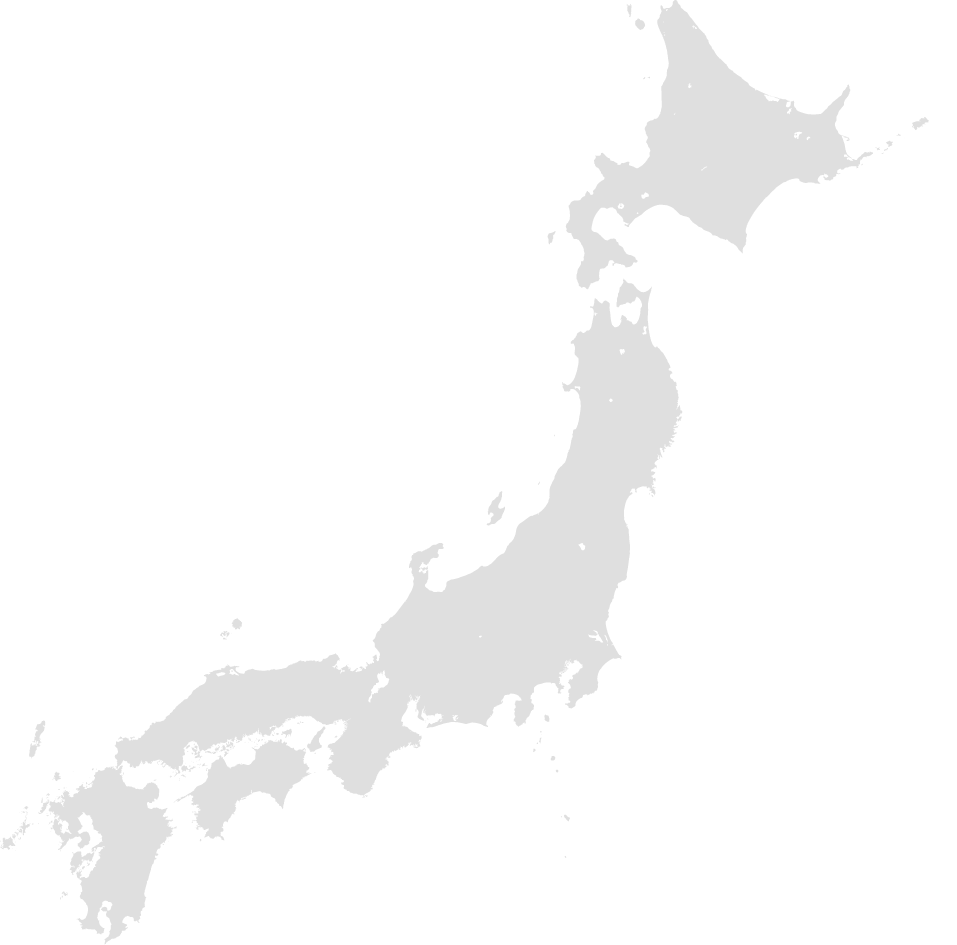


* Approximately 2,900km
(Wakkanai City-Cape Sata Park/one way)
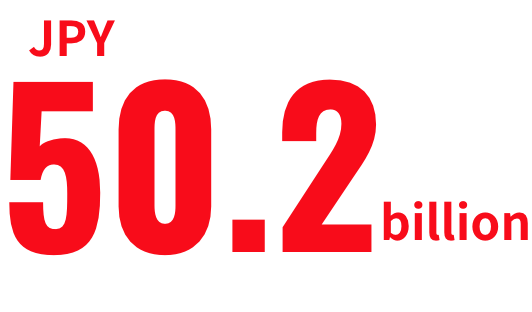
Market capitalization
September, 2012 fiscal year
June, 2025 fiscal year


* The graph is an image
*As of September 20(4Q),2012
*Except for treasury stock
*As of June 30,2025
*Except for treasury stock
Overseas sales ratio
September, 2012 fiscal year

June, 2025 fiscal year

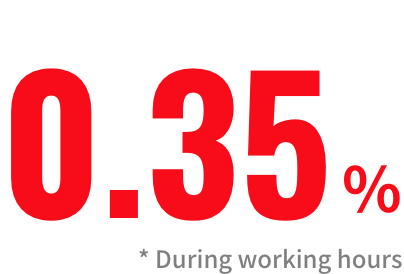
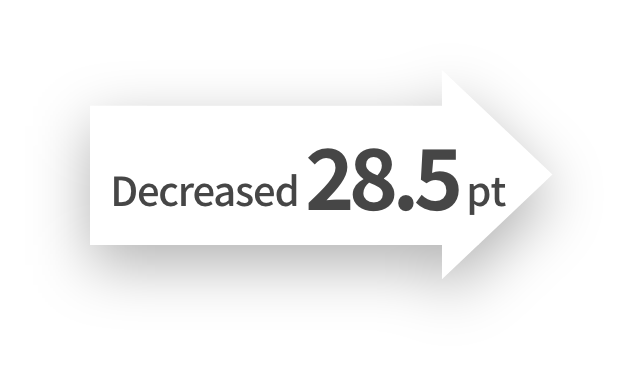
Smoking rate
As of December 2012


As of January 2025